04 | Industry overview
The product tanker market
The charter market is highly competitive and based primarily on the offered charter rate, the vessel’s location and technical specification, and the reputation of its manager.
As this simplified tanker market overview shows, the charter rates and product tanker capacities depend on several factors:
- Number of newbuilds and the number of vessels being scrapped
- Oil demand and refinery throughput
- Price of oil
- Oil inventories
- Environmental regulations
- Geopolitics and sanctions
- Location of refineries
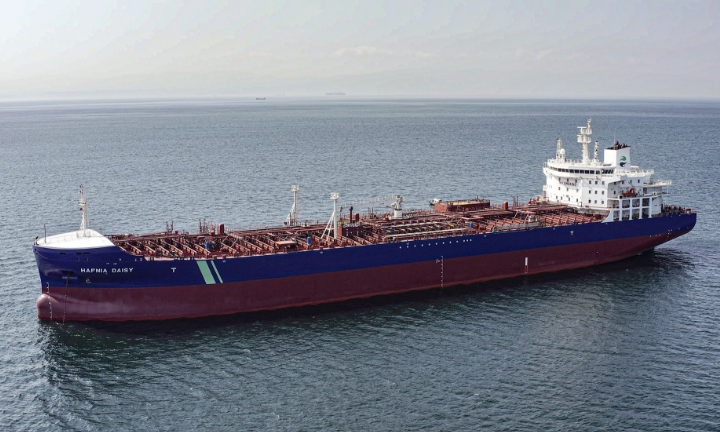
Crude tankers transport crude oil from points of production to oil refineries or storage locations. Product tankers can carry both refined and unrefined petroleum products, including crude oil, fuel oil, vacuum gas oil (dirty products), and gas oil, gasoline, jet fuel, kerosene and naphtha (clean products).
Chemical tankers can, in addition to refined products, carry Inorganic Chemicals (e.g. Caustic Soda), Edible Oils (e.g. Palm Oil, Sunflower Oil and Soybean Oil), Renewable Oils (e.g. Used Cooking Oil) and Organic Chemicals (e.g. Methanol, MEG and Paraxylene).
Freight rates for a vessel trading under spot charters are susceptible to fluctuating demand and supply of vessels, and rates are volatile. Rates are also strongly affected by seasonal fluctuations in demand from end consumers, global oil demand and inventories. Product tankers are typically dedicated to trading clean petroleum or dirty petroleum products. Clean tonnage supply can increase at times where clean trading earnings are significantly higher than dirty trading earnings as it will attract dirty tankers to clean up their tanks to clean petroleum products. This is a costly process which is not done easily.

2021 Reflection
Markets
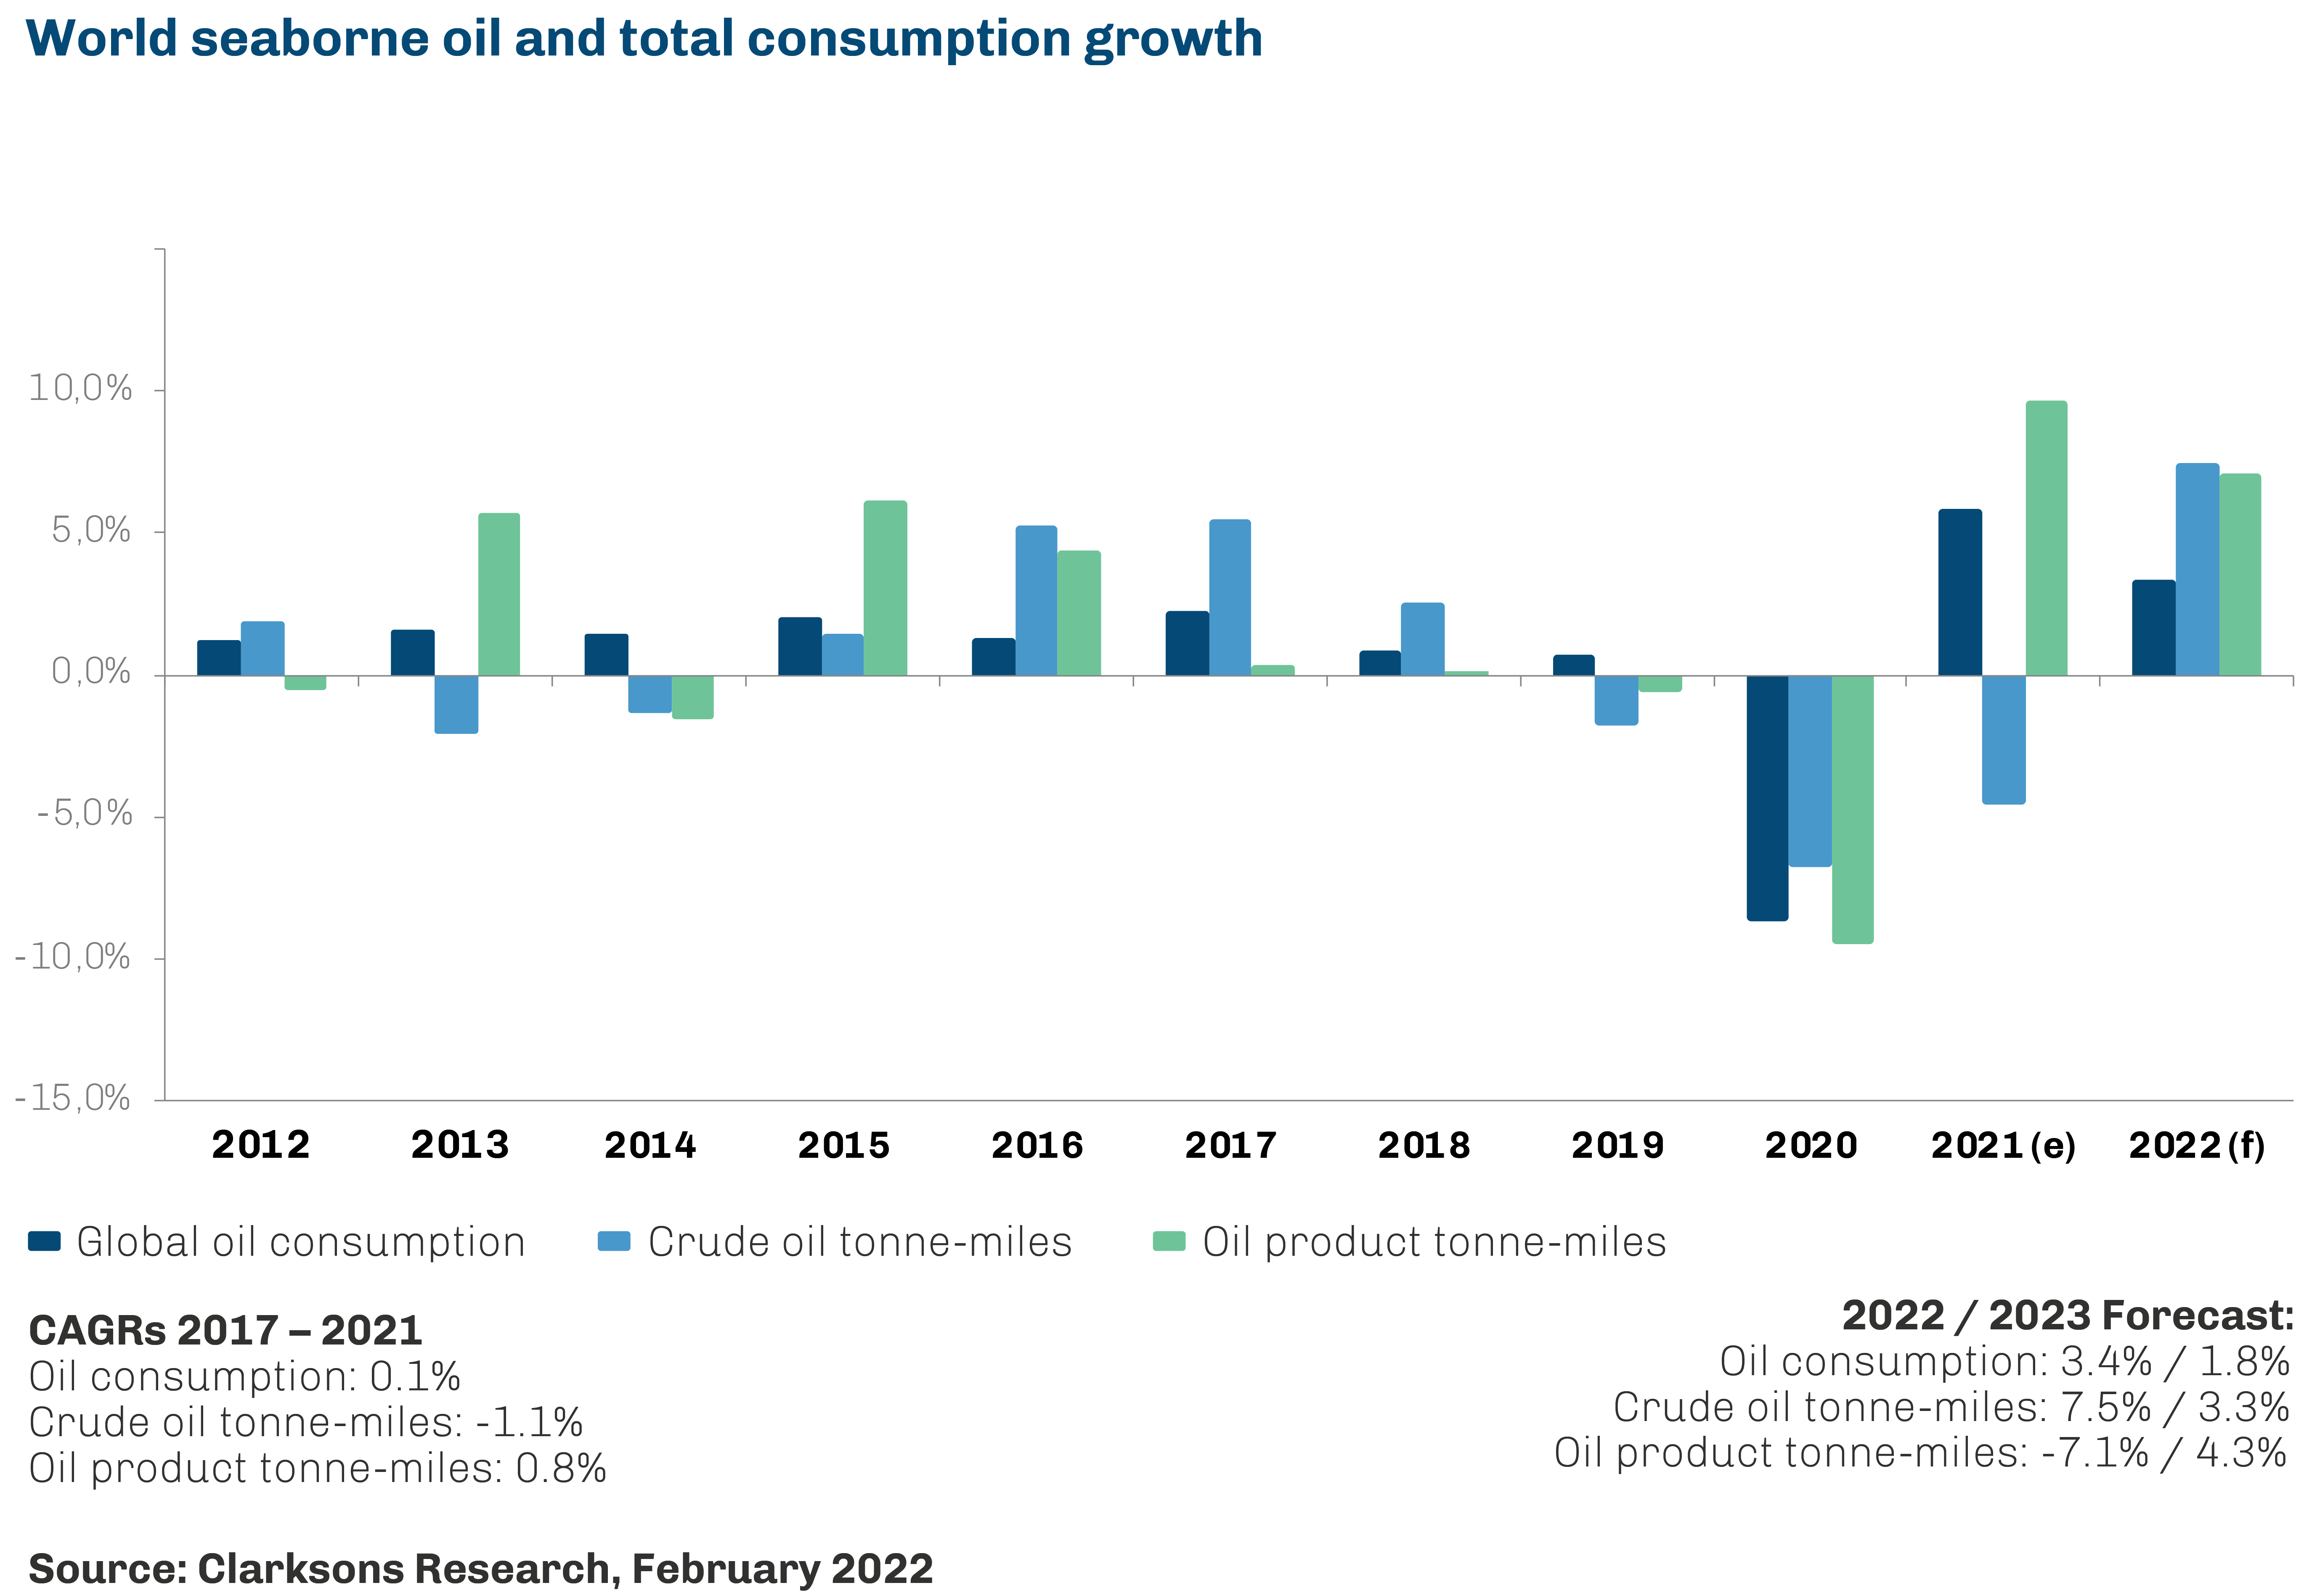
The tanker markets continued to see extremely challenging conditions throughout 2021, experiencing an extended period of bottom-of-the-cycle level earnings since the second half of 2020, representing the weakest earnings environment for over 30 years. Despite continued gradual improvements from the Q2 2020 lows, global oil demand and refinery runs in 2021 remained 3% and 5% below 2019 levels, respectively, limiting the recovery in seaborne oil trade (volumes estimated to still be down 7% vs 2019 levels in Q4 2021), whilst continued OPEC+ cuts (albeit starting to unwind) and high oil inventories entering 2021 also exerted significant pressure. Meanwhile, total oil tanker floating storage has largely returned to close to pre-Covid-19 levels (4% of fleet capacity at end 2021, vs ~11% in May 2020 and ~3% at start 2020, according to Clarksons Research data).
Whilst both the crude and products sectors in 2021 had a weak market, crude tankers overall appeared to fare somewhat worse than their coated counterparts owing to continued weakness in crude oil trade volumes, particularly Middle East Gulf amid ongoing OPEC+ production cuts, compared to gradual improvements in seaborne products trade. Small improvements were seen in Q4 2021 from the Q3 2021 lows, amid slightly higher activity seasonally, weather-related delays and ice tonnage requirements, although this was short-lived.
Meanwhile, Clarksons Research data average weighted product tanker spot earnings averaged below USD 7,000/day for four consecutive quarters from Q4 2020 – the longest period at such low levels in over 30 years. However, overall earnings in Q4 2021 picked up slightly amid higher levels of activity, taking the full-year average to just over USD 7,000/day (although this still represented a fall of 60% y-o-y).
An uptick in gasoline and diesel flows in Q4 2021 gave support to MR and Handy earnings, whilst LR earnings began to improve somewhat in Q3 2021, helped by firm petrochemical feedstock demand in Asia and competitive pricing of naphtha vs propane in the second half of 2021, particularly for LR2s. Earlier in 2021, market disruptions also spurred some brief periods of firmer rates for product tankers, with the Suez Canal blockage resulting in a temporary uplift to earnings in the LR market, whilst the temporary closure of the Colonial Pipeline in the US led to a slight uptick in demand in the West and supported MR rates before subsequently easing back.
Similarly to the crude sector, in the full year, the larger end of the product tanker segment saw the greatest pressure on market conditions, with LR2 earnings on the benchmark MEG-Japan CPP route averaging USD 7,700/day (2010 built, non-scrubber ship), down 73% y-o-y, whilst LR1 earnings on the same route fell by 64% y-o-y to average USD 7,000/day. Premiums remained for ‘eco’ and scrubber-fitted ships and held somewhat firmer ‘eco’ LR1 earnings averaged USD 9,500/day, while scrubber-fitted ‘eco’ units saw average earnings of USD 11,600/day, down by a lesser 56% and 51% y-o-y respectively. Meanwhile, average clean MR spot earnings averaged USD 6,700/day, down 56% y-o-y. Product tankers also saw increased competition from VLCCs taking clean cargoes on their maiden voyages owing to the record low rates experienced by the larger crude tankers, particularly impacting the larger product tanker sectors.
Trade & Demand
Overall, despite y-o-y improvements in global oil supply, demand and refinery runs (+1.6%, +5.8% and +4.0%, respectively), seaborne oil trade showed minimal improvements in 2021, with total estimated volumes expanding by just 1% y-o-y and remaining 8% lower vs 2019 in the entire year. Weakness in seaborne crude oil trade was the key driver behind this limited recovery as volumes registered a third consecutive year of decline, contracting by an estimated 1.5% y-o-y, reflecting high oil inventories at the start of the year and the continuation of deep OPEC+ output cuts.
Although total global oil supply registered a y-o-y improvement, this was driven mainly by a return of Libyan supply following the oil blockade in the country in 2020, along with growth in Canadian and Iranian supply, whilst total OPEC+ output averaged lower for the year (-1%). With OPEC+ accounting for 45-50% of global crude and NGL production and 65-70% of global seaborne crude trade, pressure on OPEC+ output influenced seaborne crude trade patterns more heavily.
Improvements in global oil demand were largely driven by rebounds in the US, European and Chinese oil demand (combined accounting for 60% of the growth in 2021). However, stock drawdowns and refinery closures in Europe maintained pressure on crude imports despite improvements in utilisation (European imports grew just 1%), whilst Chinese import demand was weaker than expected (falling 6% y-o-y, the first y-o-y decline since 2001) with heavy refinery maintenance, a government ‘crackdown’ on independent refiners and firming oil prices in second-half of 2021 all exerting pressure following the rapid growth in imports seen in 2020 driven by stock building. With China and Europe accounting for over 50% of seaborne crude import volumes but 28% of global oil demand, pressure on these importers had a disproportionate effect on trade volumes (although Chinese imports still held above 2019 levels, albeit just 1.7% compared to demand standing 11% higher). Meanwhile, US demand and refinery throughput recovered by 1.5 million barrels per day (+8.3%) and 0.9 million barrels per day (+6.4%) in 2021, respectively, according to EIA data, accounting for 30% of global growth in both metrics. However, this was not translated into the country’s seaborne crude imports, which rose by an estimated 3% (<0.1 million barrels per day), partly as the country drew over 110 million barrels from inventories over 2021 (equivalent to 0.31 million barrels per day). US seaborne exports were also curbed, falling by an estimated 6% y-o-y (0.2 million barrels per day). The Middle East was another key driver of the recovery in global refinery throughput volumes, accounting for 19% of the total, which did not recover crude trade volumes, given the region’s role as an exporter. Crude tonne-mile trade fell by a sharper 4.5%, with significant reductions in long-haul trades such as US exports to Asia, Chinese imports from Latin America and West Africa, and Middle Eastern exports to the US. Meanwhile, notable growth was seen on shorter haul routes ex-Med due to Libyan volumes’ return, particularly to Europe.
Global seaborne oil products trade (which fell by 11.5% in 2020 to 20.7 million barrels per day) saw some improvement across 2021 and has taken significant steps forward from the Q2 2020 low (-26% y-o-y in May 2020 according to Clarksons Research data estimates), supported by gradually recovering oil demand. Unlike crude trade, the seaborne products trade recovery has so far been largely in line with the recovery in global oil demand and refinery runs. Volumes in 2021 rose by an estimated 5.3% and in Q4 2021 stood up 14% from Q2 2020 and up 10% from the second half of 2020 average, supported by recovering industrial activity and increased demand for transportation fuels as ‘lockdown’ measures in key regions eased. Nonetheless, volumes in 2021 remained 7% below 2019 levels, partly reflecting the impact of high inventories at the start of the year, and continued pressure on global oil demand from impacts from Covid-19. However, volumes in Q4 2021 were only 3% below the same period in 2019.
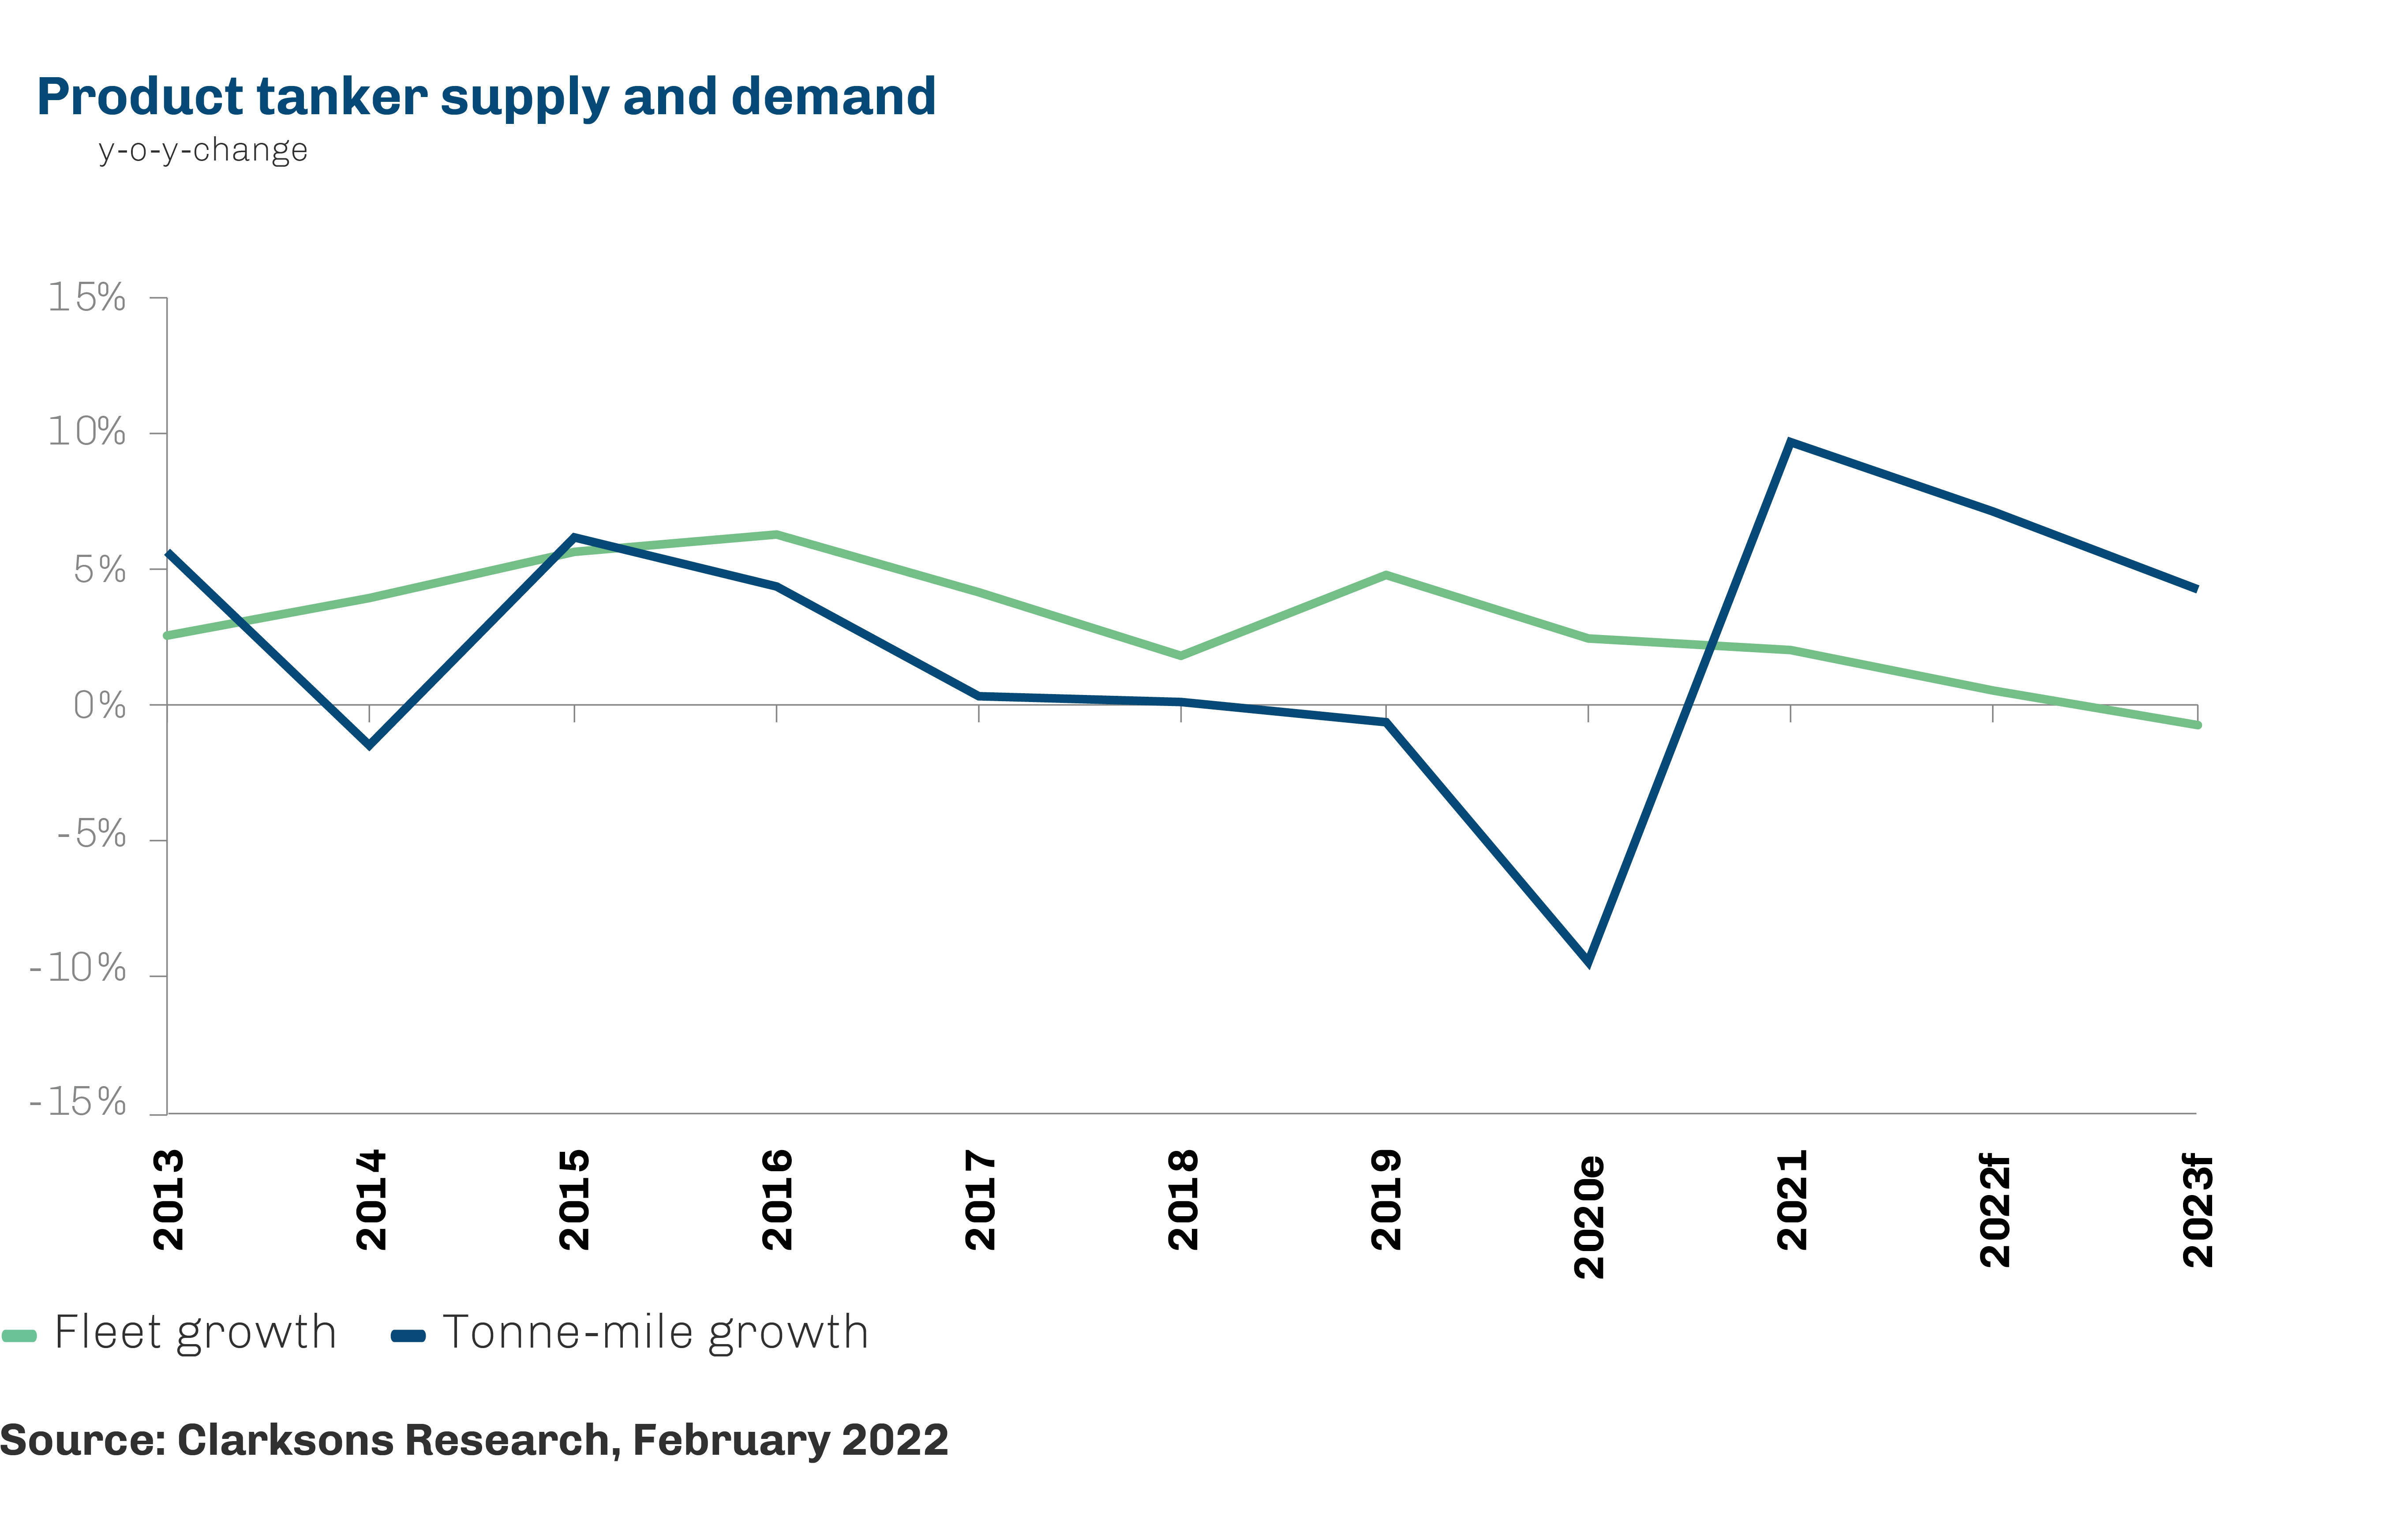
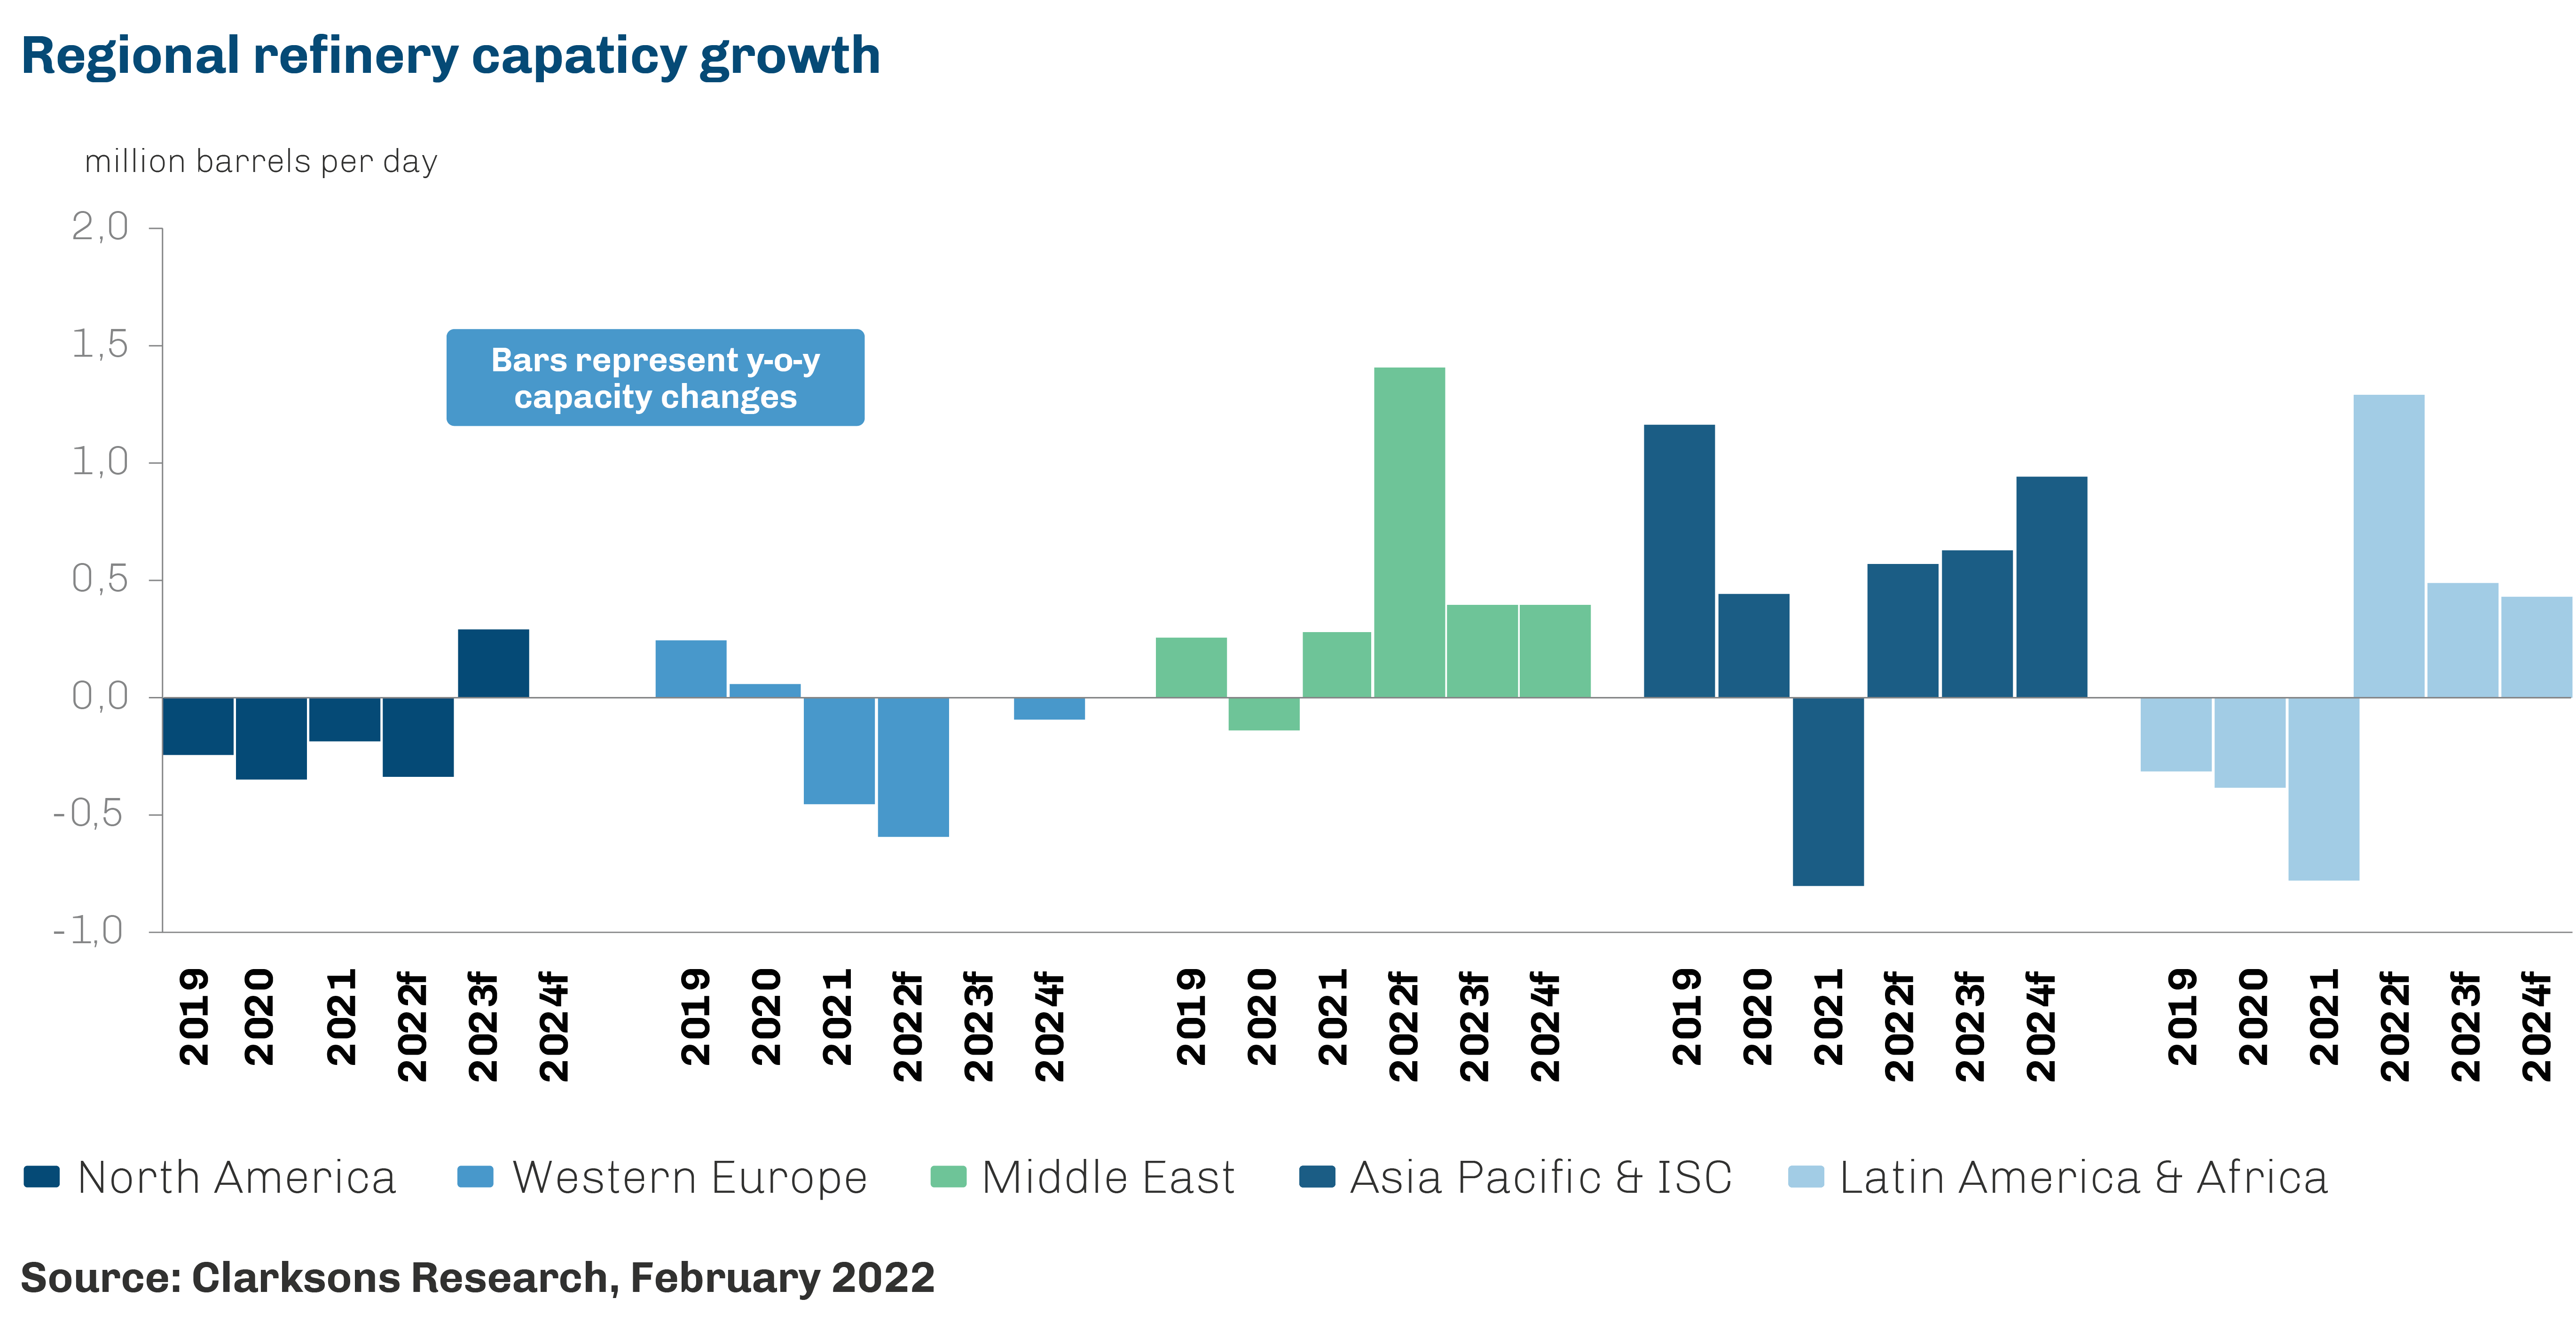
Major export-oriented refinery start-ups and expansions in Saudi Arabia, Kuwait and the UAE helped to drive the growth of 21% in Middle Eastern exports in the full year 2021. Meanwhile, a firm rebound in US oil demand helped drive a 16% rebound in US seaborne products imports, with the recovery in US refinery throughput lagging demand improvements. US gasoline imports rose 37% y-o-y in January-November 2021, with US vehicle miles travelled rising 11% y-o-y in January-October. Disruption from the Colonial Pipeline cyber-attack in May 2021 also saw a significant boost to imports (particularly gasoline flows from Europe and the Middle East) which surged to 2.4 million barrels per day across May-June 2021, the highest monthly level since July 2019. Meanwhile, refinery closures in Australia and firm demand for naphtha into Japan and Korea (up 15% y-o-y) supported a 13% rise in seaborne products imports into OECD Asia, up 12% on 2019 levels according to CRS estimates. Long-haul flows from the Middle East to Asia saw the greatest volume growth in 2021, supporting a much firmer rebound in products tonnemile trade growth of 9.7% in 2021.
Supply Side
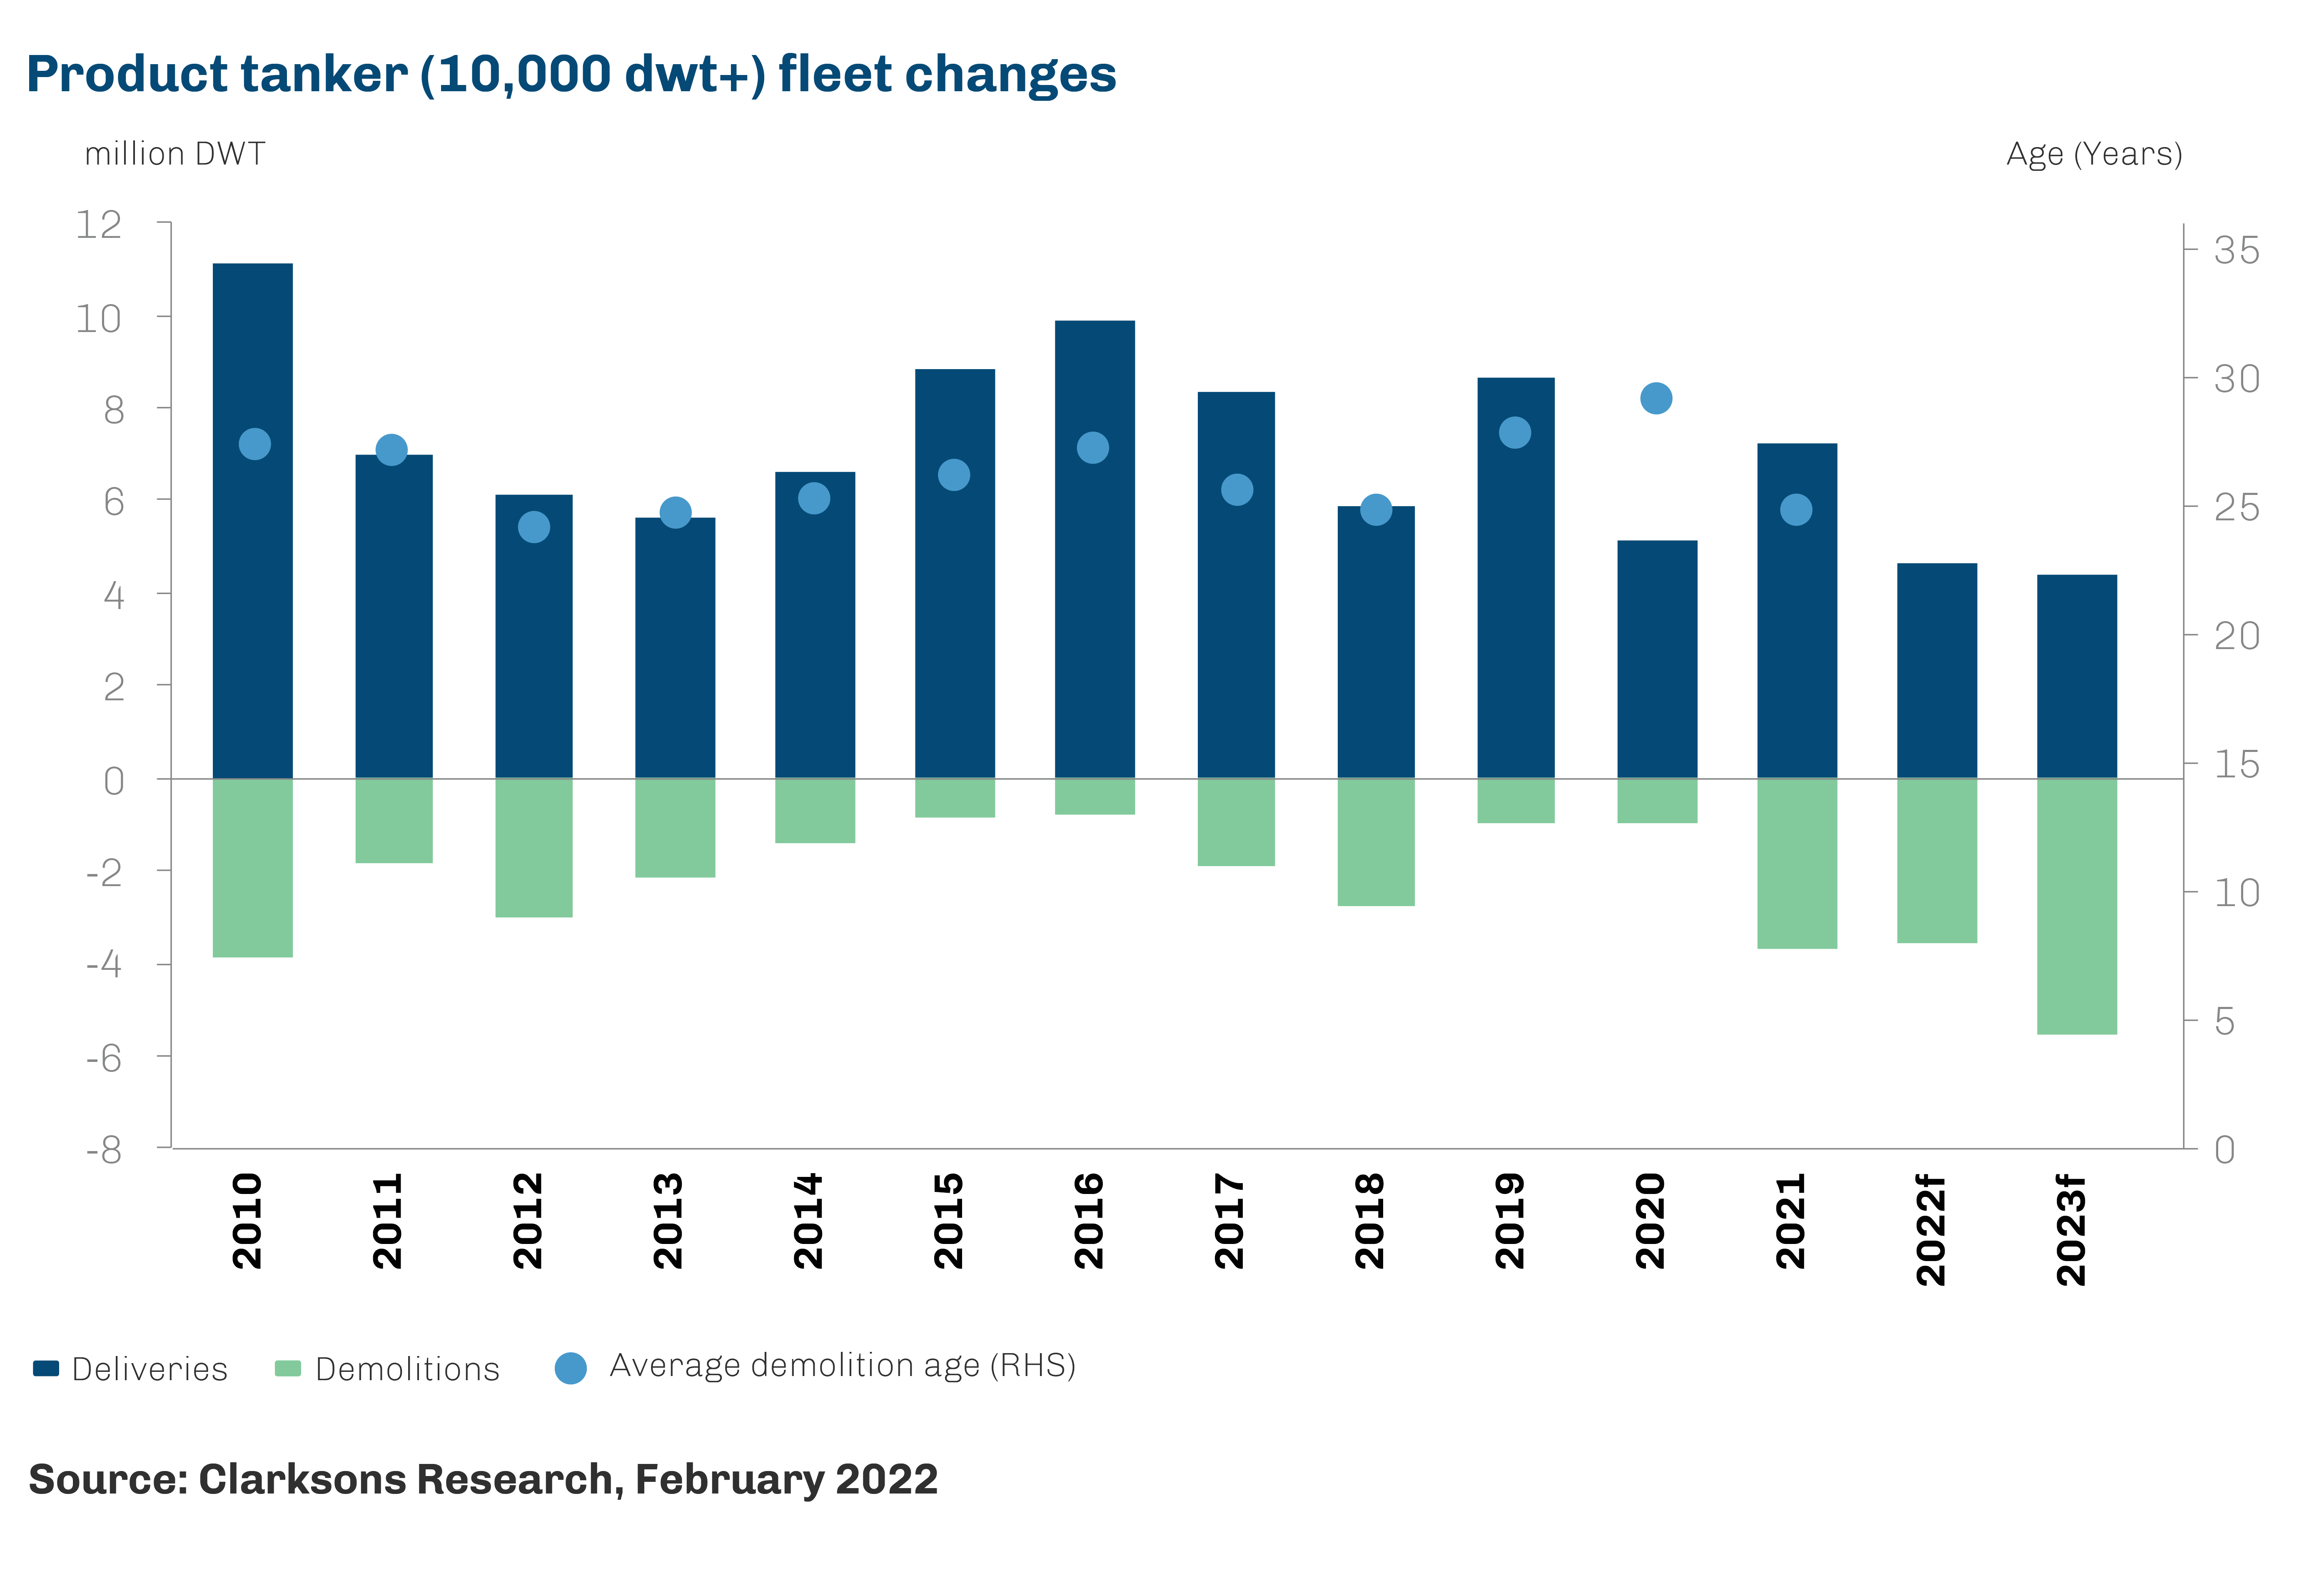
Expansion in the oil tanker fleet (10k+ dwt) remained moderate in 2021, with capacity increasing by 1.6% in 2021 (1.5% crude, 2.0% products 10k+ dwt) according to Clarksons Research data, following growth of 3.1% in 2020. Deliveries were fairly steady, totalling 24.5 million dwt, whilst recycling accelerated amid weak market conditions and elevated scrap prices. Scrap values rose rapidly throughout 2021 to the highest levels since mid-2008 and have continued rising in 2022 so far, with the scrap value for an LR1 standing at USD 9 million in February 2022. In total, 14.4 million dwt was sold for scrap in 2021, more than double the total volume sold across full years 2019 and 2020 combined (and including a number of VLCCs previously reported to have been engaged in ‘subterfuge’ trading). However, scrapping has perhaps been weaker than initially expected so far, possibly reflecting the impact of firm demand for older units in the sale and purchase market.
Floating storage unwound substantially from the peak in May 2020 ( 12% of crude tanker capacity and 10% of product tankers 10k+ dwt) to 6.5% and 3% of fleet capacity (crude and products, respectively) by the end of 2020. Storage eased back slightly further across 2021 to end the year at 5% and 2% of crude and product tanker fleet capacity, respectively, albeit remaining elevated vs pre-Covid-19 levels. The ‘active’ supply growth in 2021 is estimated to have been 5% and 4% on an annual basis for crude and product tankers, respectively, compounded by a reduction in the share of the fleet off-hire for SOx scrubber retrofits (1.0% across 2020 to 0.4% across 2021 for total oil tankers).
2022 Outlook
The tanker markets have started 2022 on weak footing, with earnings across all sectors slipping back across January-Febuary amid lower cargo volumes, partly owing to impacts from the outbreak of the Omicron Covid-19 variant, whilst rising bunker prices have also impacted. Average weighted crude tanker earnings in the first six weeks of the year have softened by 31% vs the December average, with VLCC earnings (2010 built, non-scrubber fitted) falling back into negative territory from mid-January and coming increasingly under pressure amid significant vessel oversupply. Average weighted product tanker earnings have slipped back 27%, with the LR sector posting the largest decline owing to long tonnage lists.
However, the market is expected to gradually improve through 2022, with support from continued recovery in oil demand and supply from the 2020 lows (though uncertainties remain, including those recently building around Russia and Ukraine that short term has led to an increase in ton-mile due to product supply from the eastern hemisphere). The impact of the Omicron variant on global oil demand appears to have been more limited than previous waves of Covid-19 and consensus expectations are for oil demand to return to pre-Covid-19 levels later this year, with oil demand in the full year expected to average a level similar to 2019. Meanwhile, oil supply is projected to expand by a firm 5.6% on the back of easing OPEC+ cuts and strong growth in US supply. According to IEA forecasts, refinery runs are expected to further recover from 2020 lows, with global crude throughput averaging a level just shy of that seen in 2019. Nevertheless, gains appear to be more focused on the second half of the year, given the phased easing of OPEC+ cuts and the current extent of tonnage oversupply, and the extent of cumulative fleet growth may limit upside since the start of Covid-19.
Crude tonne-mile trade is currently projected to expand by 7%, outpacing trade growth of 6% largely owing to the return of growth in long-haul volumes ex-US, notably to Asia, and the replacement of some Mexico-US trade with imports from more distant suppliers such as ECSA and the Middle East following PEMEX’s decision to end crude exports in 2023. However, tonne-mile trade is expected to remain 4% below pre-Covid-19 levels in 2022 and, whilst total crude tanker fleet growth is projected to remain fairly moderate at 2.6%, latest projections suggest that by the end of 2022 crude tanker fleet capacity will stand 7-8% above end 2019 levels. This capacity growth is expected to be focussed at the larger end, with total crude Aframax fleet capacity is projected to stand just 1% above end 2019 levels. Crude tanker floating storage remains above pre-pandemic levels. Further unwinding is expected across 2022, particularly given the current high oil price environment, contributing to further oversupply of tonnage and maintaining pressure on market conditions. With such supply- side pressures remaining, material improvements in the crude tanker freight market are not expected to materialise until towards the end of 2022, when some seasonal uplift is expected and as OPEC+ fully phase out supply cuts. However, whilst the return of OPEC+ volumes is expected to support growth in trade volumes, the upside is expected to be limited by the start-up of large refineries in the Middle East, curbing exports from the region to below 2019 levels.
The potential return of Iranian crude volumes to oil markets should sanctions be lifted this year could further support seaborne crude trade volumes provided OPEC+ does not agree to renewed production restrictions. Seaborne products exports may also see some uplift given Iran’s refining capacity upgrades over the past few years. However, there remains significant uncertainty over the timing of any deal between the US and Iran is reached. Additionally, there have been reports of a considerable number of aging tankers operating as part of a ‘subterfuge’ fleet, transporting sanctioned crude volumes. However, due to the elderly nature of these vessels, many may be scrapped, particularly if scrap prices remain elevated although there exists a wide range of scenarios. Whilst the lifting of sanctions may boost traded volumes, impacts on available fleet supply could be negative should this tonnage return to the regular trading fleet.
Product tankers are once again expected to fare better than their dirty counterparts in 2022, with a further 6% growth in trade volumes to levels just below the pre-Covid-19 level supported by continued improvements in global oil demand and refinery runs. Refinery closures in Europe and Australasia are expected to drive firm growth in imports into these regions, of 11% and 24%, respectively, with longer-haul exports from the Middle East expected to fill much of the supply gap following the start-up of significant volumes of new refinery capacity in the region. Expectations are also for continued firm growth in naphtha trade to East Asia, largely on longer-haul routes from the Middle East owing to the start-up of new petrochemical capacity with flexible feedstock capability in China and South Korea. As a result, product tonne-mile trade and product tanker demand growth are expected to exceed the rate of trade growth at 7% in 2022, with tonnemile trade rising 6% above 2019 levels. Vessel demand growth is expected to be healthy across all product tanker segments, although the LR2 and MR sectors are currently expected to see the fastest growth (% apiece), with demand in 2022 standing 8-9% above 2019 levels. Meanwhile, LR1 demand growth is expected to expand by a slower 6% to stand 2-3% above 2019 levels. The majority of the expected volume growth is on more MR focused intra-Asian routes or ex-MEG routes to Asia and Europe with more LR2 focus. However, with the LR1 fleet set for a second consecutive year of contraction (latest forecasts suggest -0.2% to 28.1 million dwt as the order book currently comprises just one vessel and stands at 0.3% of fleet capacity following no contracts being placed since the end 2018).
Fundamentals in the sector appear supportive of an improvement in rates over the course of the year. Total product tanker fleet growth (10k+ dwt) is currently expected to expand by just 0.6% in 2022. However, floating storage remains above pre-pandemic levels (c.2% of product tanker fleet capacity in 2022 so far, similarly for LR1s), unwinding of which may raise ‘active’ fleet growth somewhat, ‘active’ supply growth is still expected to remain limited to c.1%. There remains potential for the continuation of competition from large crude tankers carrying clean products cargoes on their maiden voyages given the largely unsupportive fundamentals in the crude tanker markets expected for 2022.
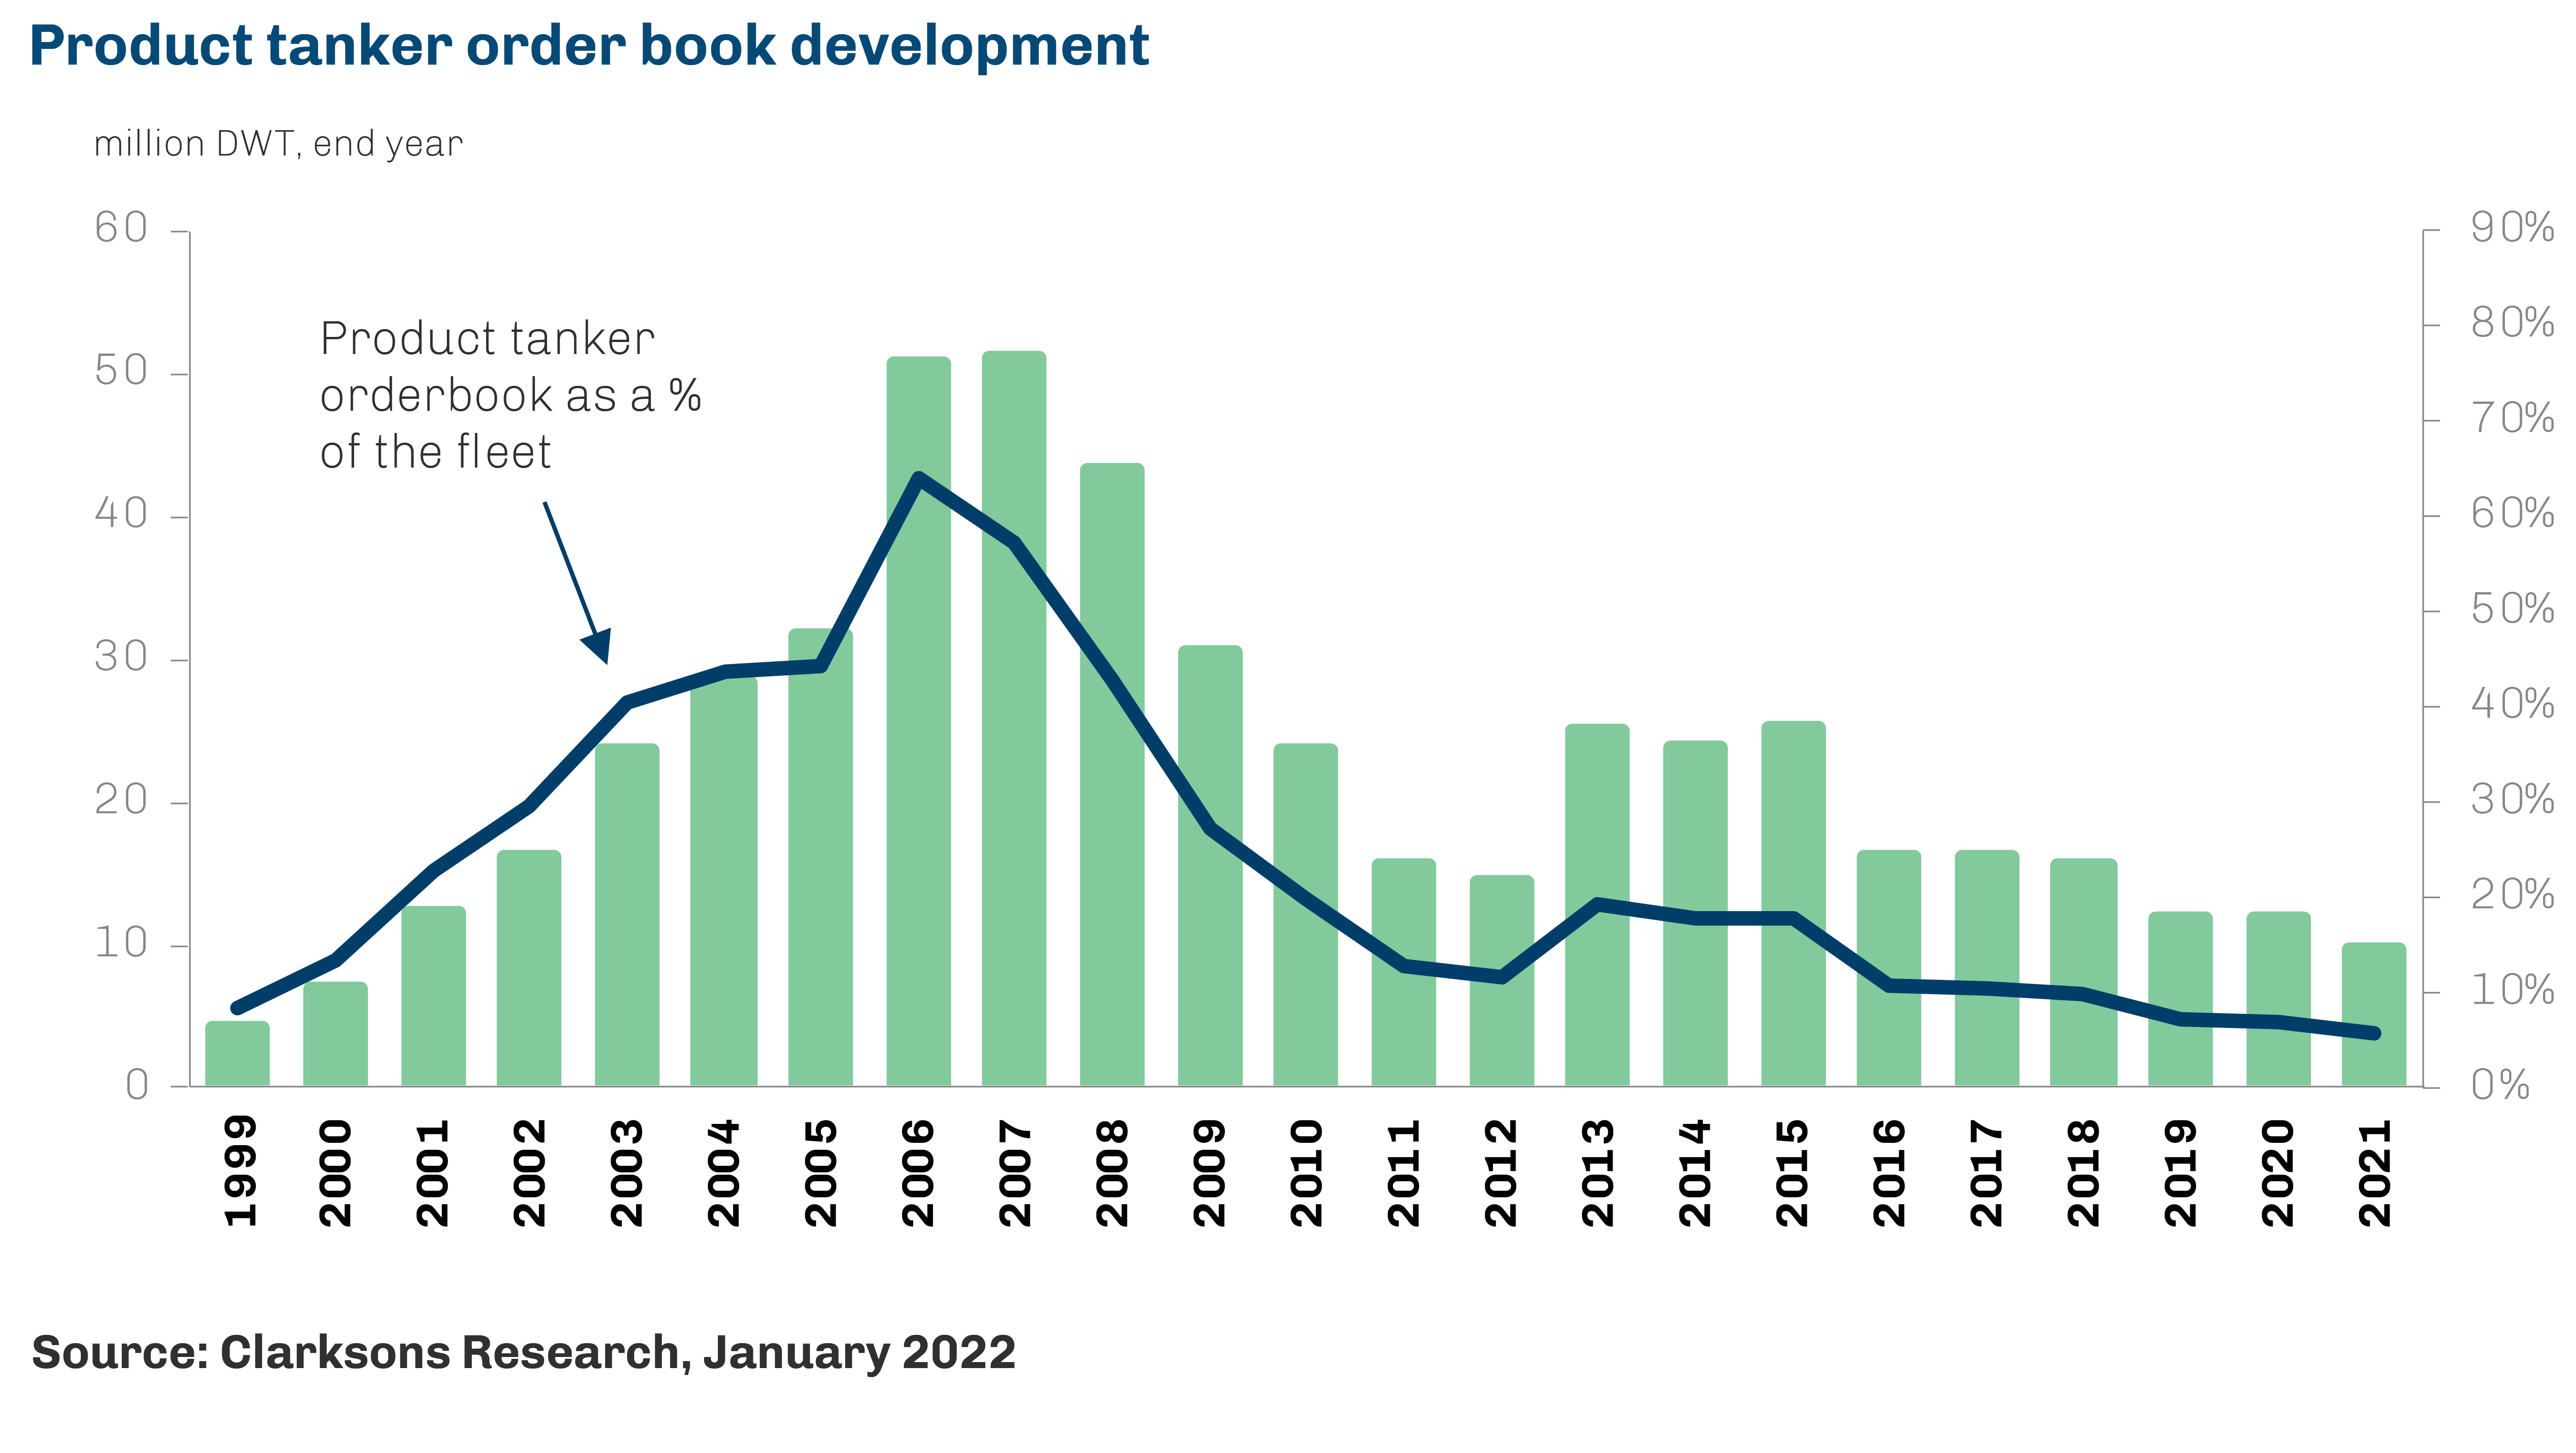
Further ahead, supply-side trends look set to provide positive impetus to tanker market fundamentals. With the tanker order book historically limited (crude tanker currently at 7.5% of fleet capacity – the lowest since start 1997 – and product tanker 10k+ dwt at 5.3% – its lowest in over 26 years), oil tanker supply growth further ahead is expected to moderate further. Growing impacts from environmental regulations also suggest the potential for a more positive period for the tanker market. For example, introducing EEXI and CII regulations in 2023 could encourage accelerated scrapping, reductions in operating speeds, and possible time out of service for the retrofit of ESTs. Additionally, the increasing uptake of alternative fuels as the green transition picks up pace is also expected to lead to accelerated fleet renewal, c.31% of oil tanker tonnage on order (10k+ dwt) is now set to be alternative fuel capable with ordering of LNG capable vessels having picked up significantly in 2021.

Source: IEA, February 2022